Imagine that you want to run a marketing campaign targeting your active customers with personalized recommendations. As described in earlier blog posts on this site, you have multiple options on what recommendation strategy to adopt: talk about their favourite category, get them to explore newer categories, talk about what similar customers are buying etc.
Which naturally raises the question: Which strategy should you choose?
You have two options:
- Use your domain knowledge to decide what works for whom. For instance, a lookalike strategy (people like you…) might be chosen for first timers, a category exploration strategy might be chosen for people who transact frequently but whose loyalty to the brand we want to reinforce by adding more categories to their shopping cart etc. This strategy works if we know the customer base very well, and wish to implement a specific strategy that advances a business objective.
- Test and learn. This approach is ideal when you don’t have perfect knowledge about your customer base, and wish to let the data tell us what works for whom. This article focuses on a way to test and learn, by framing it as a multi-armed bandit problem.
Bandits? Where?
What exactly is a multi-armed bandit? To understand the origin of the term, let us first talk about one-armed bandits.

Figure 1 Source: fullcirclecinema.com
No. not this guy.
Have you ever been to a casino? Played on one of the slot machines? Now, slot machines these days have become very drab, electronically controlled machines where you push a button to operate it, but the old-style slot machines had a big crank on one side that looked like a metal arm. You put in a coin, pulled the crank, and watched the dials spin until, hopefully, they all landed on the same thing, and you won a lot of money. In reality, of course, casinos like to stay in business, so the winning happened quite rarely. So, what you had was a machine with one arm that took your money… hence the term one-armed bandit.
Now imagine that you landed up in an old-style casino in Vegas. (Can you hear Frank Sinatra in the background? Good!) Arrayed before you is a row of slot machines. (Many arms, still with the same felicity at taking your money, hence multi-armed bandits.) Each slot machine has a fixed, but unknown, probability of paying off. You have a bunch of coins, and must decide how to use them effectively. (Let’s assume, for the moment, that putting the coins back in your pocket and using it to prepay a mortgage isn’t an option. Where’s the fun in that?)
- Equal allocation: You could simply put an equal number of coins in each machine, and one of them would pay off more often than the others, and hopefully return enough money to make it worth your while.
- Adaptive allocation: You could start putting coins in each slot machine, and then, as you see one of them paying off more often than the others, put the rest of your coins there.
The latter strategy seems better, because it adapts to what we know about the payoff rates of the various machines, and prevents us from spending too much on slot machines that don’t pay off too well. The fine print, of course, is knowing how much knowledge is enough, before we decide what to do.
Here’s a way of thinking about this. Imagine that you put one coin into each machine, and one of them paid off. In a way, you now have a machine that pays off 100% of the time (1 of 1) and a bunch of others that pay off 0% of the time. But common-sense dictates that we have too little data to draw that conclusion. Extend that logic a little further, and we arrive at this: the more data we have, the more confident we are in knowing which machine is best. Trouble is, if you extend it even further, you end up having to put so many coins into each machine that you’re back to the equal allocation strategy. Which means, you want to put just enough coins in each machine to know enough about their payoff rates and decide.
Imagine that you’re keeping a running tally of the number of coins you put in each machine, and how many times it’s paid off. The picture below shows what you might conclude about a machine that pays off 20% of the time, based on the number of coins you put into it.

Figure 2 The number of times a slot machine has paid off, given a varying number of tries
The horizontal axis represents the true payoff rate of the slot machine, a number we don’t know. (What we know is just how many times it’s paid off, in how many trials.) The peak of the curve represents the observed success rate. In the first picture above, it’s at 24%. However, since we’ve only pulled on that slot machine’s arm 50 times, we know there isn’t enough data to conclude that the 24% success rate is absolutely right. There’s some chance that it’s less than 24%, and some chance that it’s greater. That’s what the spread around the peak represents. The true success rate (20%) is represented by the vertical dotted line. Notice how the spread gets narrower, and the distribution itself gets centered around the 20% mark, as you see more and more data. In other words, as you pull on the slot machine’s arm more times, you grow more confident that the success rate you see is the truth.
Now, imagine doing this with two machines, labelled red and blue. Let’s say you’ve tried the red one 200 times and the blue one 50 times, and here’s the result.
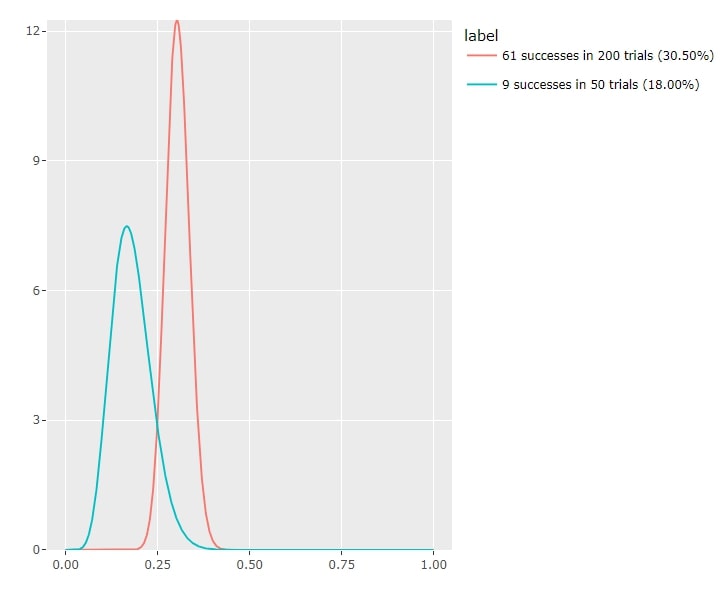
Figure 3 The case of two slot machines
Now, by and large the red machine is more likely to be the better one to choose, but there’s still a possibility that its true success rate is lower than what has been observed (the section of the red curve that is to the left of its peak). Similarly, there’s a chance that the blue machine is better than the data so far has suggested (the section of the blue curve that is to the right of its peak). Which means, there’s some chance that the blue machine is better than the red one (look at the area where the two curves overlap).
Now, the more you try both machines, the stronger your conclusions. But the intuitive idea, minus the pesky mathematical fine print, is to try the blue machine just often enough to make sure that you’re confident enough to choose the red one.
The more data you see, the more likely you are to be able to exploit what you know; the less data you see, the more likely you are to explore what you don’t. This delicate dance between exploration and exploitation is the key to winning tons of money in Vegas. (I’m kidding. The money you take to play the slot machines in Vegas stays in Vegas.)
Remind me again, why am I reading all this?
Ah yes, I forgot, you’re not living it up at the Bellagio, you’re a marketing executive.
So you have a bunch of recommender strategies and want to figure out which one might work. Well, now each recommender strategy is like a slot machine, and you get to use what you just learnt to pick a strategy.
Imagine that the red curve is the result observed so far for a personalized recommender strategy where you’re basing your recommendations on the observed customer preferences, while the blue curve is the result of a generic recommender strategy where you’re just sending out what’s popular. Or, if you want to run a different test, imagine the red and blue machines represent two different campaign creatives.
But just to make things interesting, let’s add a few more items of fine print to this discussion:
- Always explore: It’s a good idea to always “explore” a little bit. We started off our slot machine example by stating that each machine had a fixed probability of paying off. This is not how social systems work. A campaign strategy that works now might not work so well three months from now. Therefore, maintaining a minimum threshold for exploration (say, 5% for the losing strategy, no matter what) ensures that you’re constantly testing your own assumptions about what works.
- Do this by segment: If you’re testing for a diverse population, it’s a good idea to apply and adapt this approach to subsegments of the overall target population. For instance, if you have 4 segments of active customers, determined in terms of value and frequency, apply the same approach independently to each of them. This ensures that you’re getting a more nuanced sense of what works for which value-frequency segment. (An extreme case of this is what is known as the contextual multi-armed bandit. However, this is a bit harder to interpret and explain in practice, so let’s keep it simple for now.)
The moral of the story? Test and learn. And since customers will find a way to constantly surprise you, keep testing, so you keep learning!